Skip to Main Content
UCLA
Counseling and Psychological Services
Contact Us
MyStudentChart
Search Website
Search
About
About CAPS
Mission
Confidentiality
Mental Health Records
Hours and Location
Eligibility and Fees
UC SHIP Mental Health Benefits
CAPS Data Overview
Satellite Clinics
Staff
Employment Opportunities
Bruin Mental Health Advisory Committee
Services
Our Services
In Crisis?: Emergency Resources
Get Started with CAPS
Short-term Counseling and Psychotherapy
Group Treatment
Psychiatric Services
Drop-In Hours
CORE Program
ADHD Services
Disordered Eating Services
Workshops & Trainings
Forms
Resources
Emergency Resources on Campus
Campus Partners
Community and Online Therapeutic Resources
Professional Training
Graduate Training Program
Professional Development and Continuing Education
Psychiatry Fellowship Training Program
Concerned About A Bruin
Concerned About A Bruin
Resources for Parents
How to Help a Friend
Resources for Faculty, Staff, and TAs
FAQ
Contact Us
MyStudentChart
Search Website
Search
Home
About Us
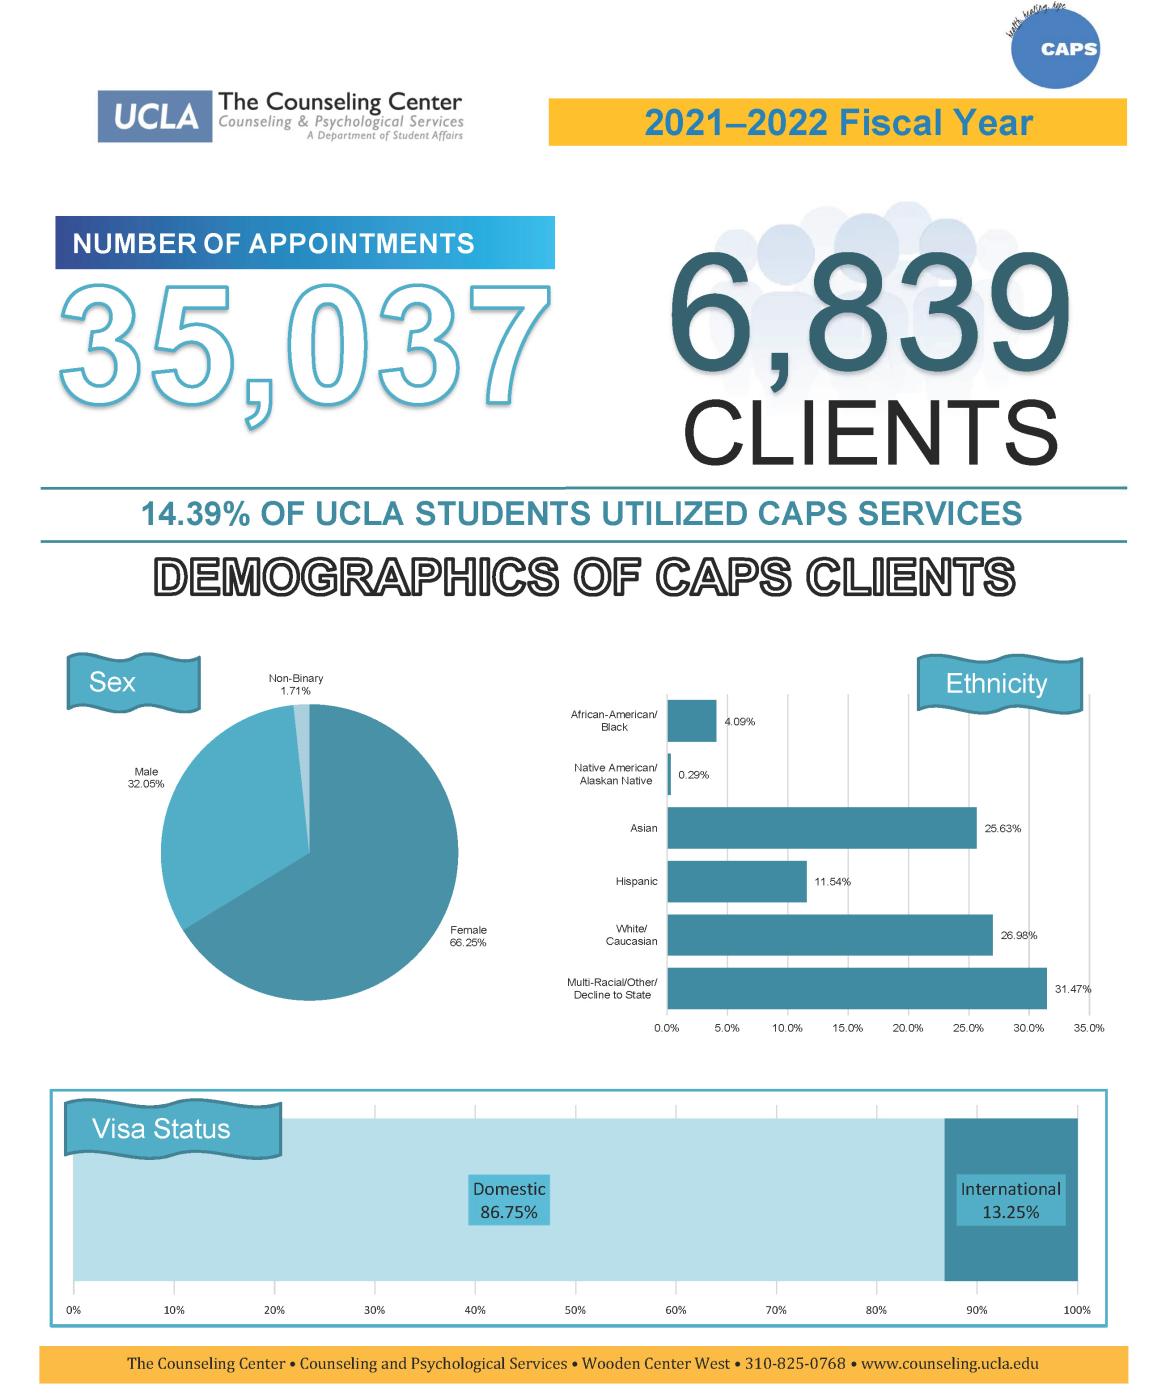
CAPS Data Overview
CAPS Data Overview